This page houses a selection of manuscript figures that I have designed over the past 8 or so years. Many of these figures were generated in
either the statistical programming software R or ArcGIS and then imported into Adobe Illustrator. Each figure
includes a legend and, if applicable, a link to the published text. This page is a work in progress and more content will be added as I find time.

Phylogenetic inference of relative monthly incidence of SARS-CoV-2 under endemic conditions. (A) Time tree based on the phylogenetic
divergence of circulating human-infecting coronaviruses. Empirical relative monthly incidences of HCoV (B) -NL63, (C) -229E, (D) -HKU1, and (E) -OC43,
and ancestral- and descendent-states analytical estimates of relative monthly incidences of SARS-CoV-2 in Trøndelag, Norway.
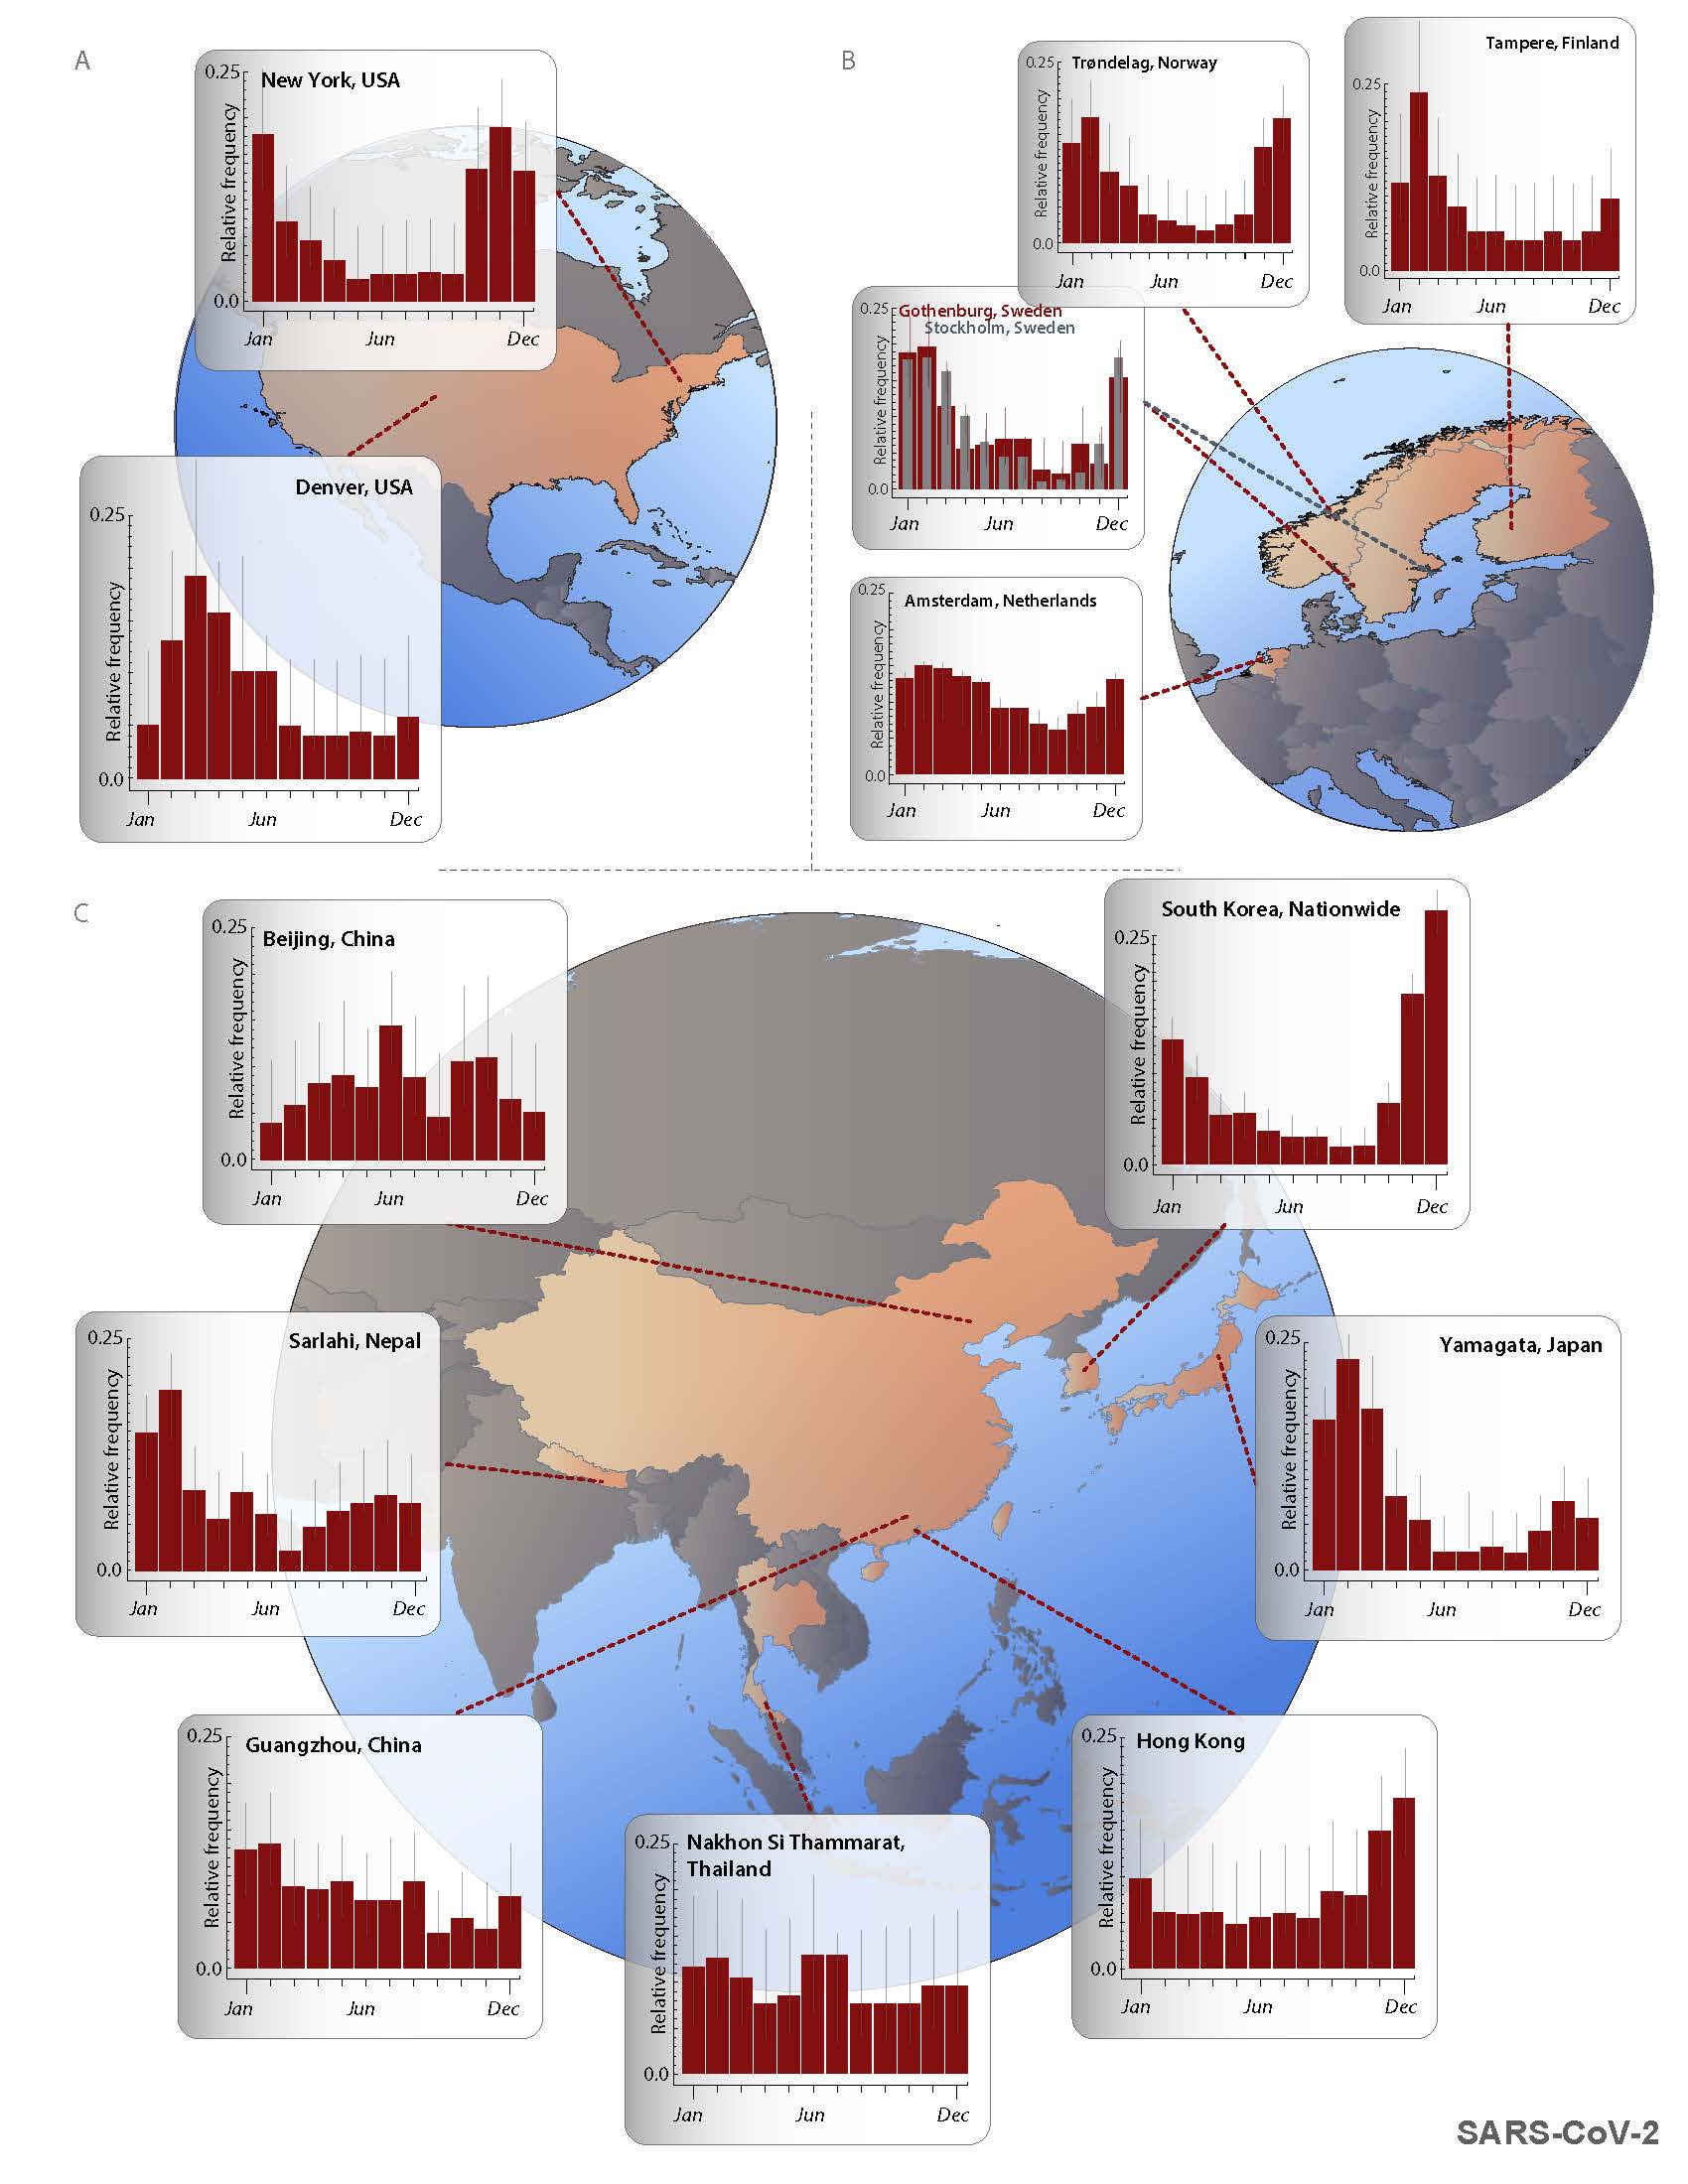
Ancestral- and descendent-states analytical estimates of the relative monthly incidence of SARS-CoV-2 under endemic conditions.
(A) New York City and Denver, USA; (B) Amsterdam, Netherlands; Gothenburg and Stockholm, Sweden; Trøndelag, Norway; and Tampere, Finland;
(C) Beijing, China; Sarlahi, Nepal; Guangzhou, China; Nakhon Si Thammarat, Thailand; Hong Kong, China; Yamagata, Japan; and South Korea
(nationwide).
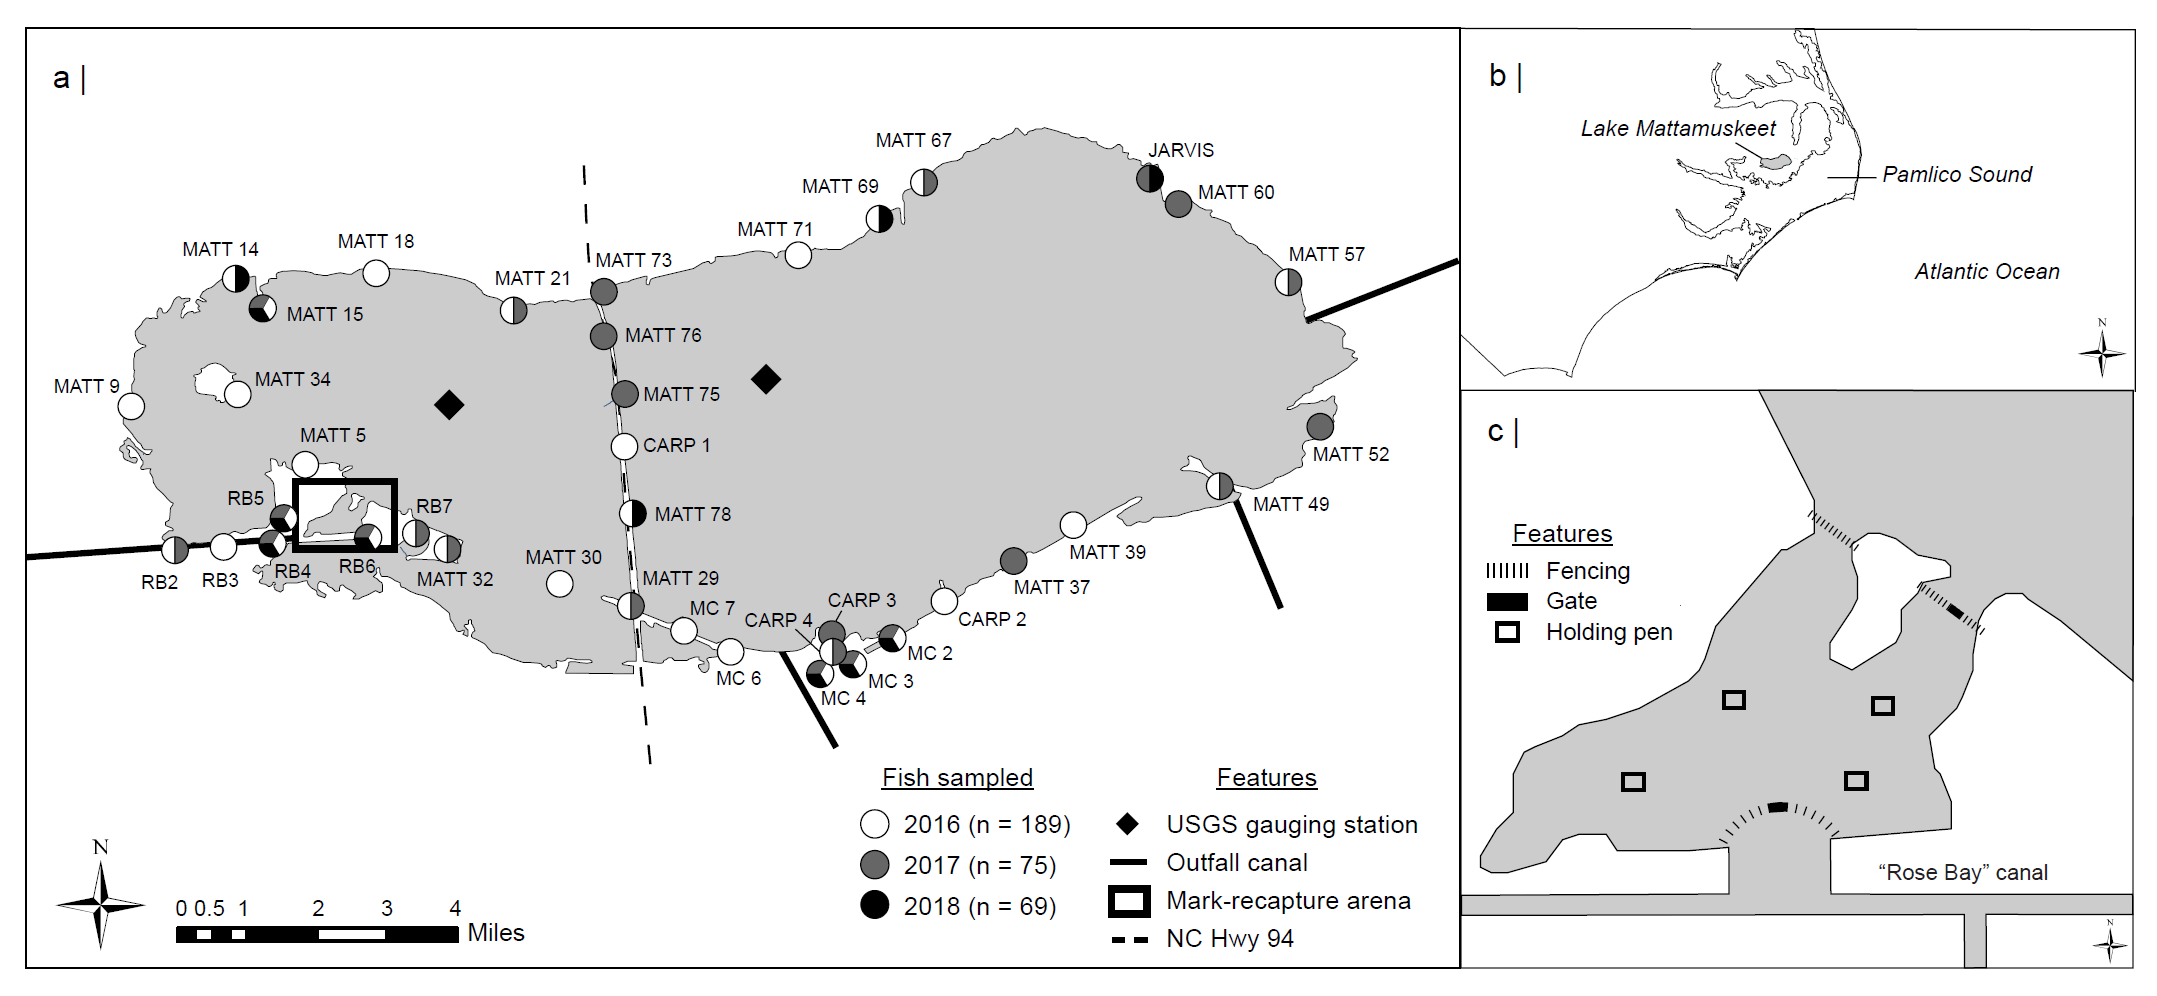
Map (a) and location (b) of the study area, Lake Mattamuskeet, in North Carolina. Fish sampling sites are marked with pie charts representing
the year(s) Common Carp were successfully captured. Diamonds indicate the locations of USGS gauging stations. The boxed region (c) represents the
location and general layout of the constructed mark-recapture arena with holding pens, fences, and gates noted. PDF
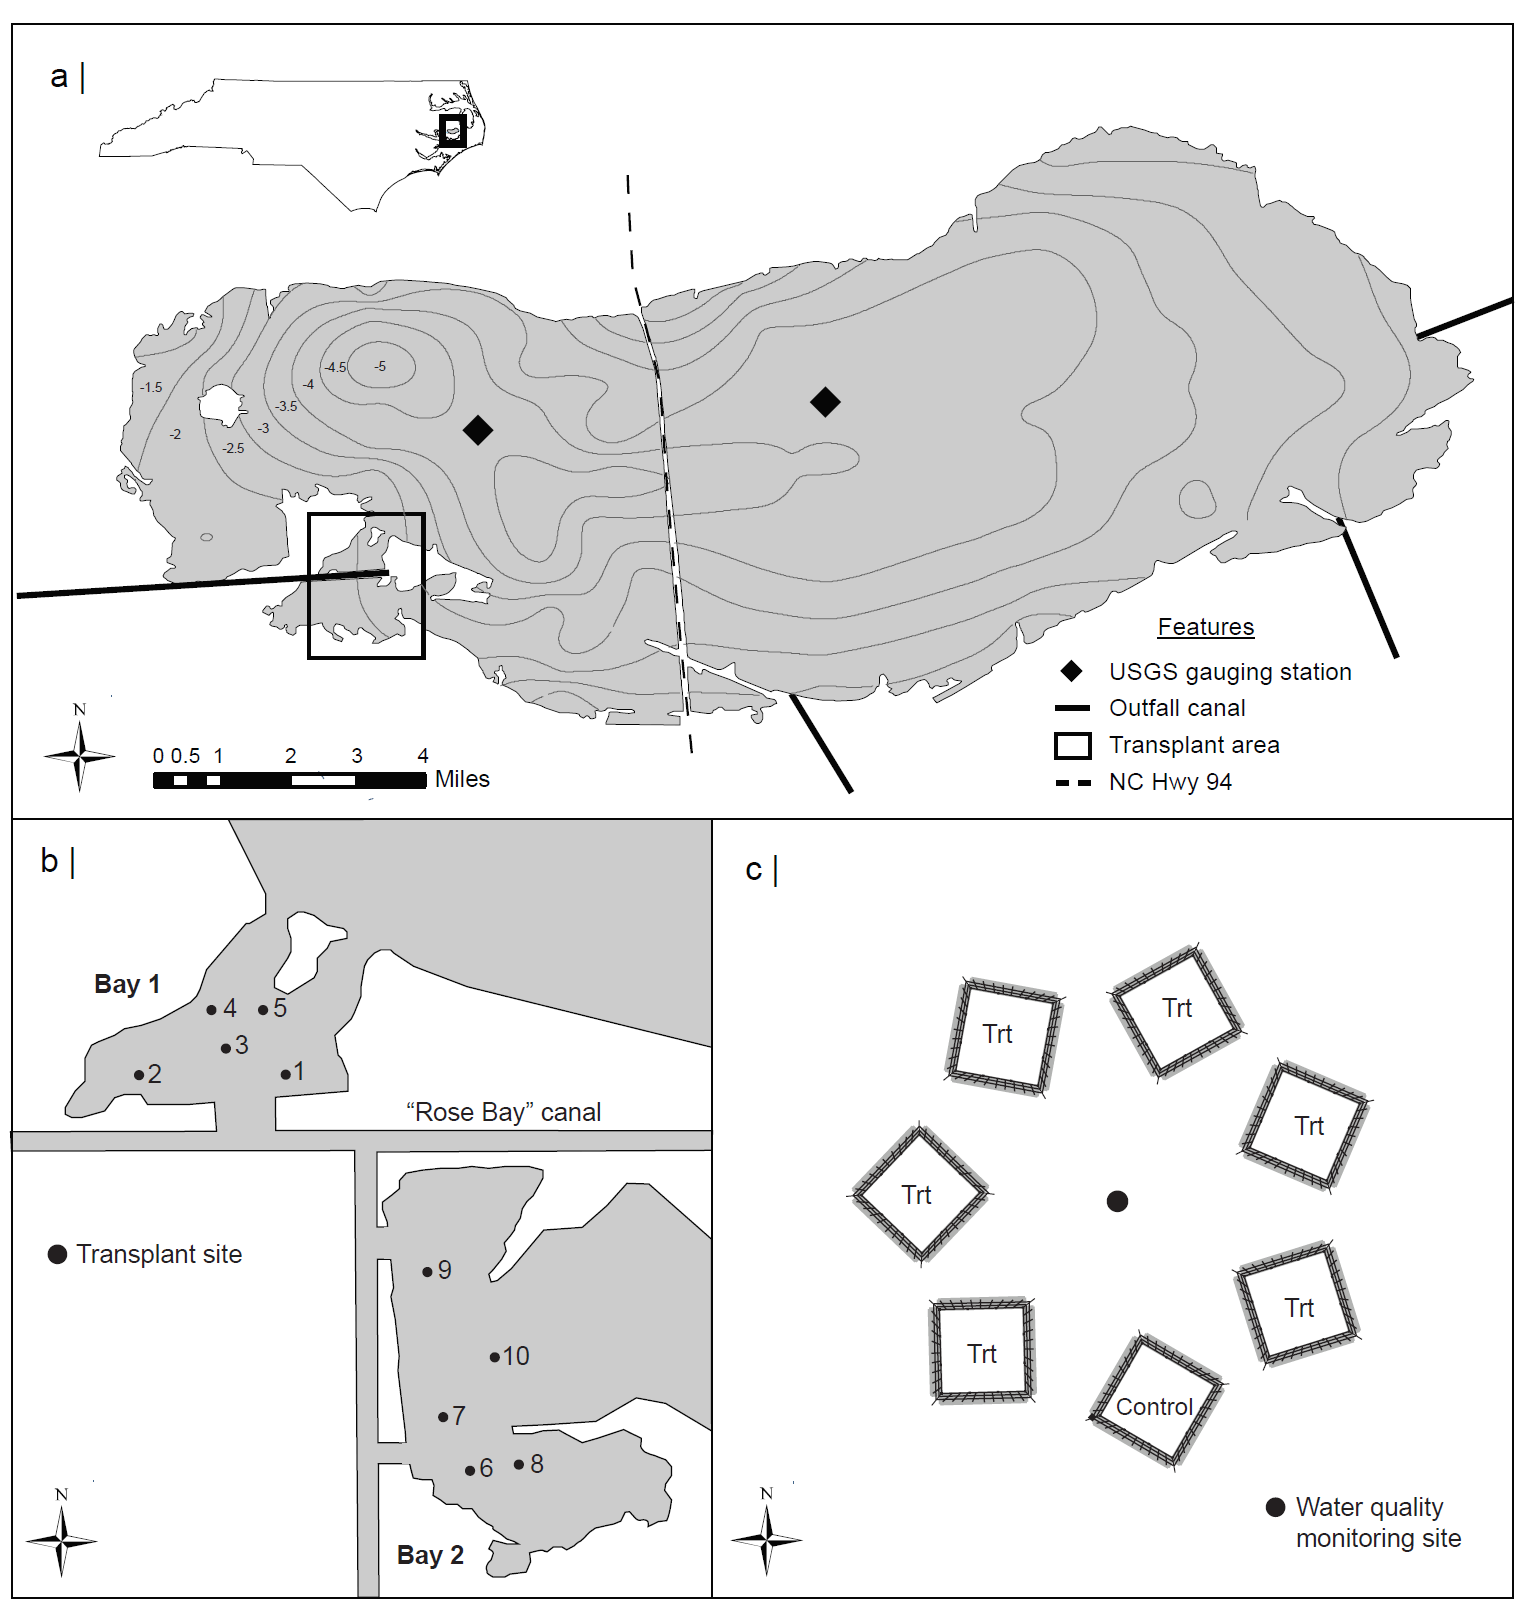
Map (a) of the study area, Lake Mattamuskeet, and its location in North Carolina. Diamonds indicate the locations of USGS gauging stations and depth
contours are represented in feet. The boxed region (b) highlights the region selected for restoration and shows the distribution of transplant sites
across bays. Each transplant location (c) contains seven enclosures, si containing unique vegetation treatments and one control cage containing no vegetation,
positioned around a centrally-located water quality monitoring site. PDF
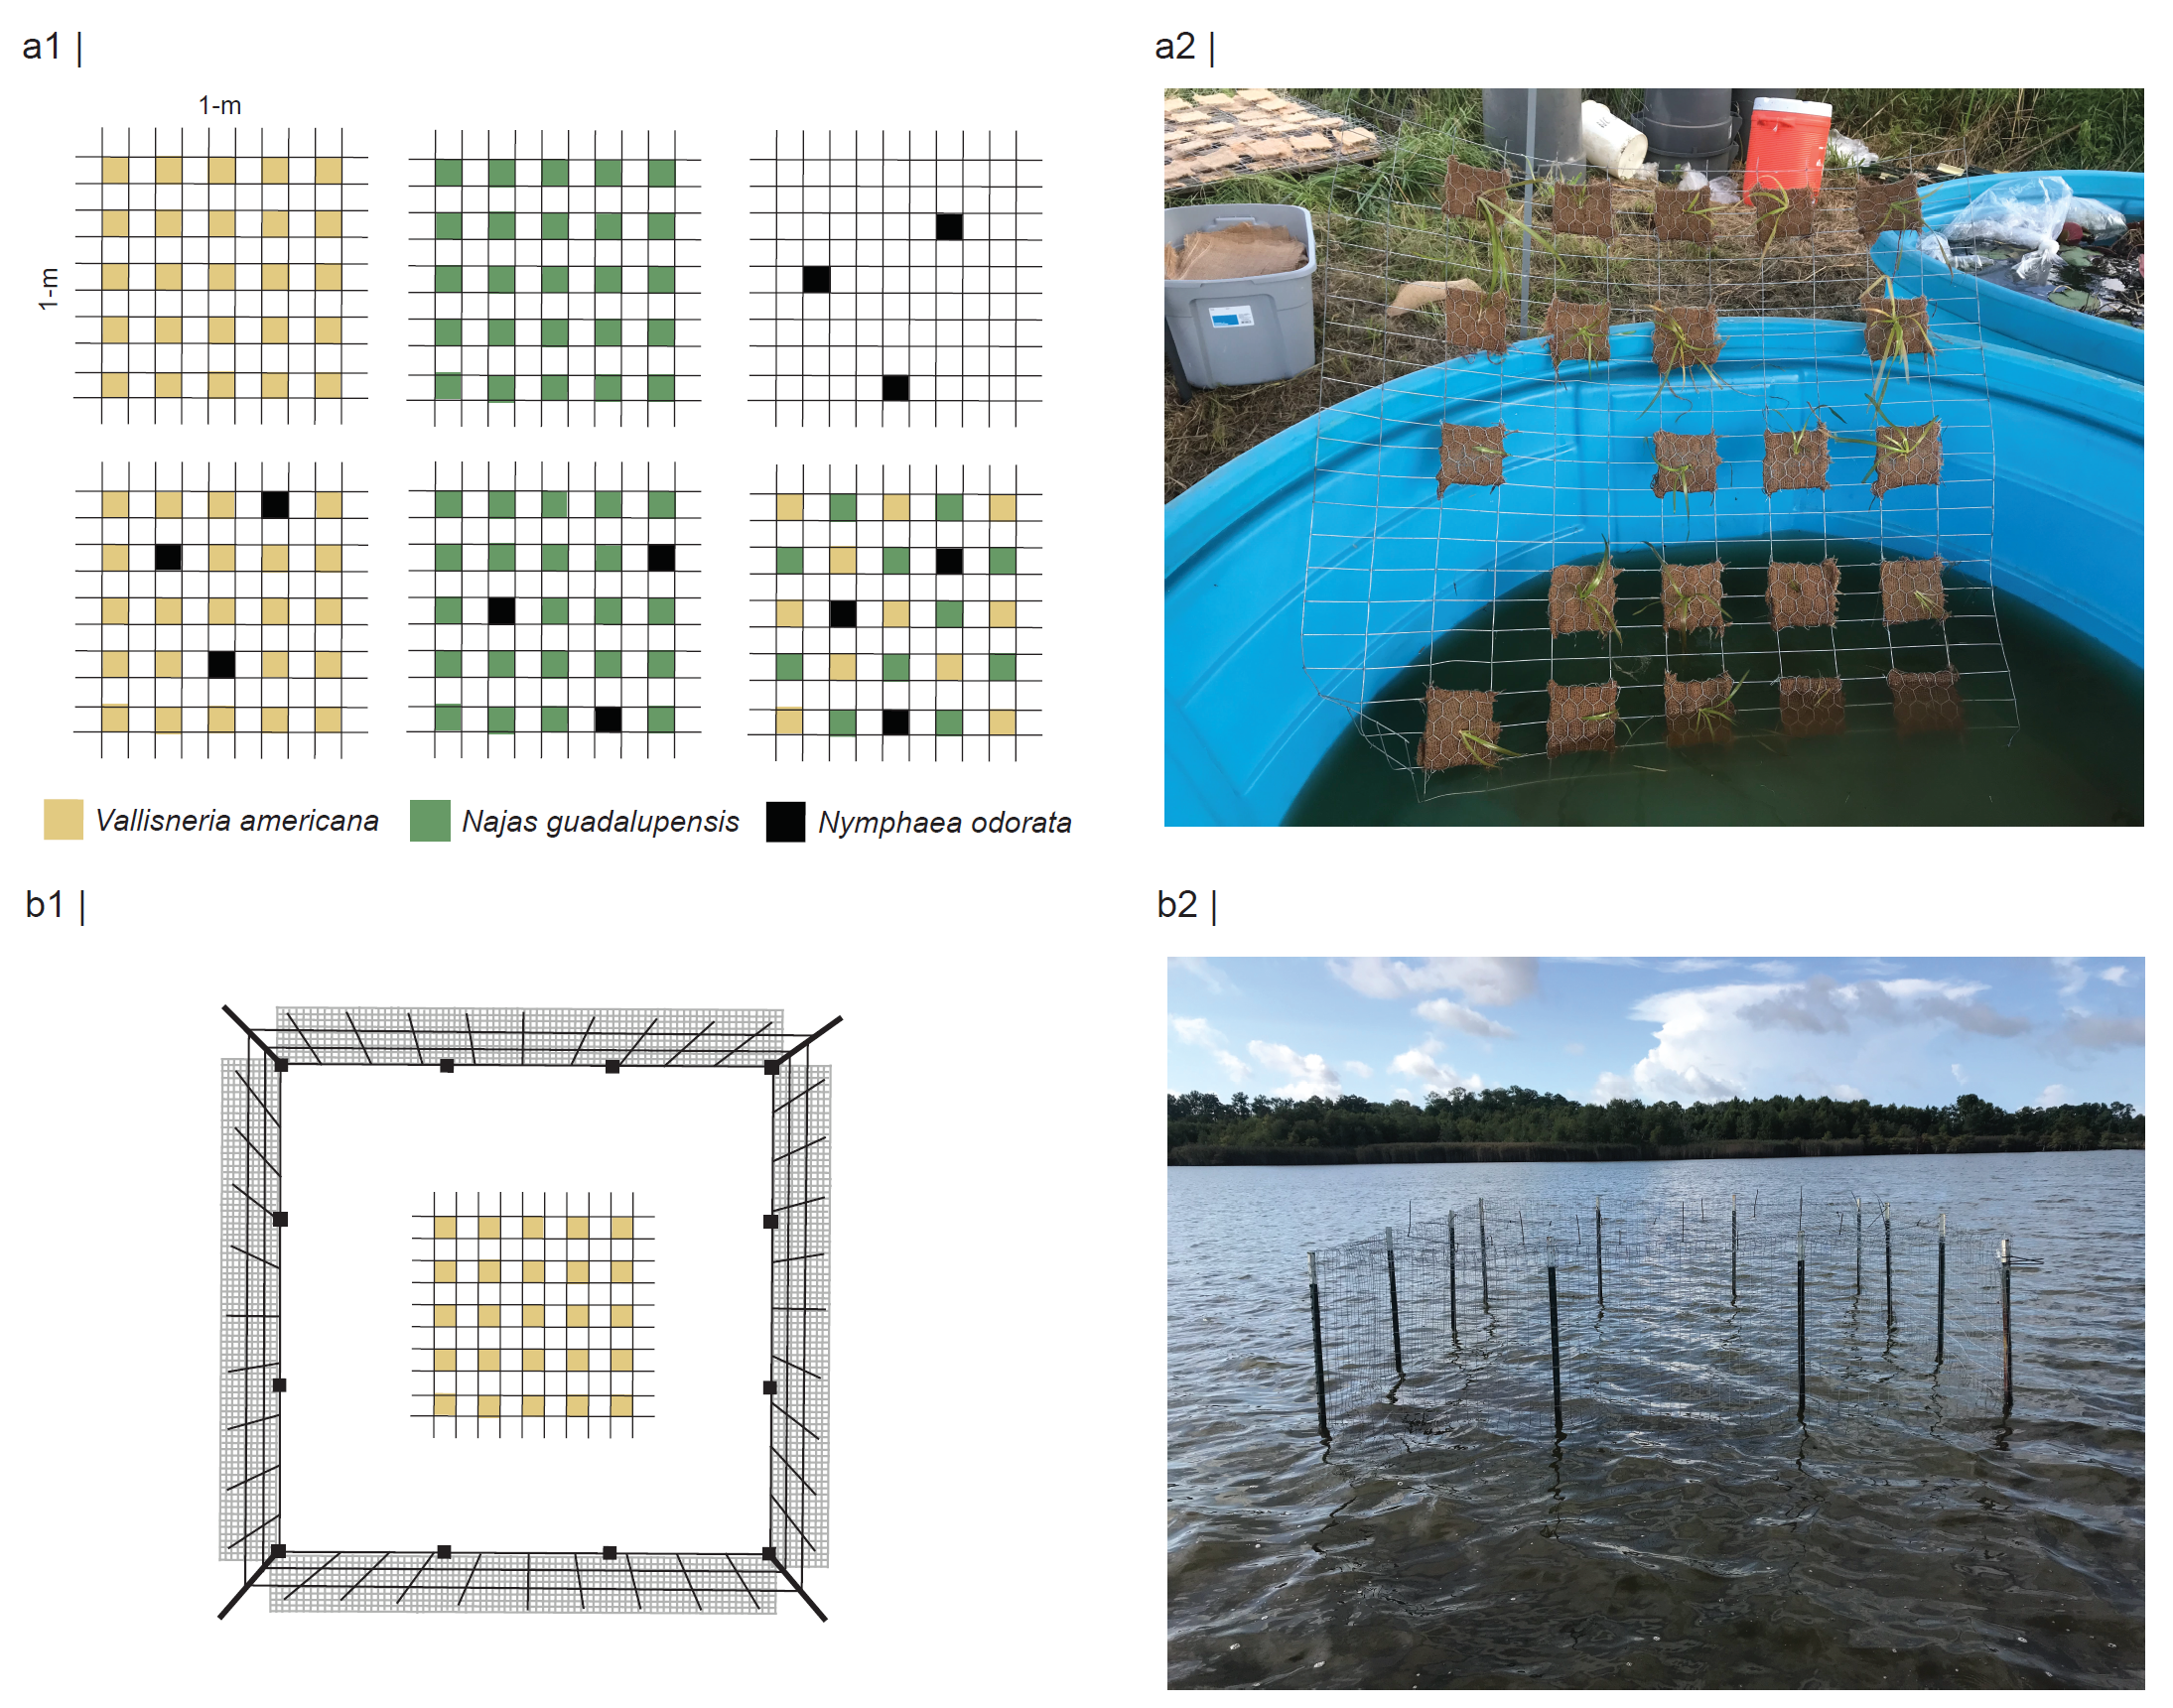
Schematic (a1) and photo (a2) showing the general layout of the six macrophyte treatments (Vallisneria americana only, Najas guadalupensis only, Nymphaea odorata
only, V. americana + N. odorata, N. guadalupensis + N. odorata, and all species) using the planting panel and burlap squares. Plant location was randomized
on each panel for the mixed-species treatments. Schematic (b1) and photo (b2) showing the construction and layout of each vegetation enclosure. PDF